
Grafana (2023): The Complete Guide to Create Interactive Dashboards
Posted on 15 Feb 14:23 | by mitsumi | 21 views

Grafana (2023): The Complete Guide to Create Interactive Dashboards
Duration: 2h 5m | Video: .MP4, 1280x720, 30 fps | Audio: AAC, 48 kHz, 2ch | Size: 604 MB
Genre: eLearning | Language: English
Duration: 2h 5m | Video: .MP4, 1280x720, 30 fps | Audio: AAC, 48 kHz, 2ch | Size: 604 MB
Genre: eLearning | Language: English
This course is designed for anyone who wants to learn about Grafana and system monitoring. The course is aimed at providing hands-on training for students to create interactive dashboards, integrate with various data sources, and perform monitoring functions through alerts and notifications. The course covers the use of Grafana, starting from the basics and progressing to an advanced level. The teaching approach is practical and focused on case studies and screen sharing, making it an effective learning experience.
The course covers a range of topics, including
Setting up an account and using local and cloud instances of Grafana
Integrating Grafana with various data sources, such as Prometheus and databases
Data treatment and analysis in Grafana
Creating custom visualizations and charts
Building interactive dashboards
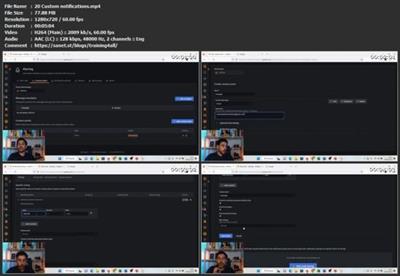
Configuring alerts and notifications
Managing users in Grafana
SQL logic
Installing and understanding the architecture of Prometheus
No prior knowledge of Grafana is required for this course. The steps are demonstrated in a clear, concise and practical manner, with best practice recommendations and tips for using the tool. All features covered in the course can be used with the free version of Grafana and Elephant SQL.
Grafana is a widely used open-source solution for monitoring and visualizing data, available in both cloud and local versions. With this course, students will be equipped with the skills to effectively use Grafana to monitor their systems and make informed decisions based on data insights.
Download link
rapidgator.net:
uploadgig.com:
nitro.download:
Related News


System Comment
Information
 Users of Visitor are not allowed to comment this publication.
Facebook Comment
Member Area
Top News