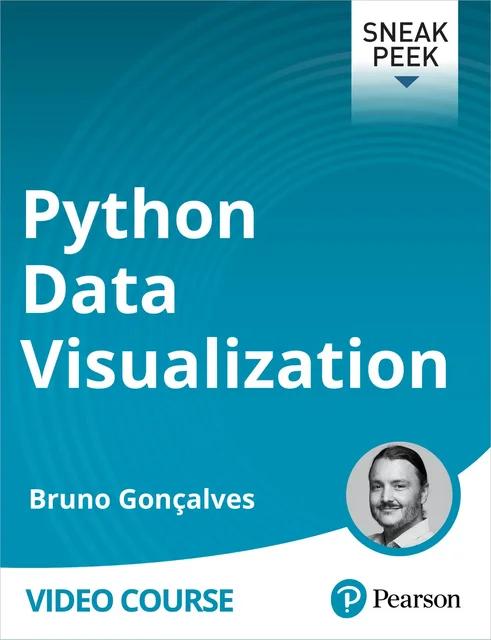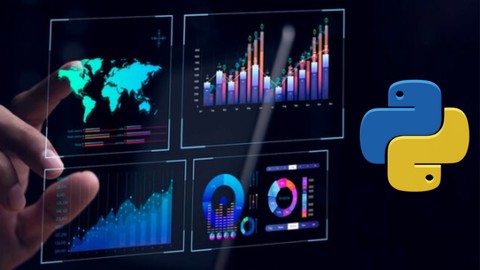
Python Data Visualization: Create impactful visuals, animations and dashboards
Posted on 19 Feb 17:23 | by BaDshaH | 10 views

Released 2/2025
By Bruno Goncalves
MP4 | Video: h264, 1280x720 | Audio: AAC, 44.1 KHz, 2 Ch
Genre: eLearning | Language: English + subtitle | Duration: 6h 36m | Size: 1.5 GB
Table of contents
Python Data Visualization: Introduction
Lesson 1: Human Perception
Topics
1.1 Understanding Color Theory
1.2 Overview of Human Vision
1.3 Color Schemes
Lesson 2: Analytical Design
Topics
2.1 Understand the Fundamental Principles of Analytical Design
2.2 Describe the Fundamental Tools of Visualization
2.3 Advantages and Disadvantages of Different Chart Types
Lesson 3: Data Cleaning and Visualizion with Pandas
Topics
3.1 DataFrames and Series
3.2 GroupBy and Pivot Tables
3.3 Merge and Join
3.4 The Plot Function
3.5 Demo
3.6 Time Series
3.7 Bar Plot Demo
Lesson 4: Matplotlib
Topics
4.1 Fundamental Components of a matplotlib plot
4.2 Explore the matplotlib API
4.3 Demo
4.4 Stylesheets
4.5 Demo
4.6 Mapping
4.7 Demo
Lesson 5: Matploltib Animations
Topics
5.1 Matploltib Animation API
5.2 Func Animation
5.3 Animation Writers
5.4 Demo
Lesson 6: Jupyter Widgets
Topics
6.1 ipywidgets as Interactive Browser Controls
6.2 Simple Wdget Use
6.3 Widget Customization
6.4 Demo
Lesson 7: Seaborn
Topics
7.1 Understand the Structure of seaborn
7.2 Understand the Differences with matplotlib
7.3 Explore the Seaborn API
7.4 Demo
Lesson 8: Bokeh
Topics
8.1 Basic Plotting with Bokeh
8.2 Advanced Plotting
8.3 Networks
8.4 Demo
Lesson 9: Plotly
Topics
9.1 Basic Plotly
9.2 3D and Animated Plots
9.3 Demo
Summary
Python Data Visualization: Summary

https://ddownload.com/bmje9xev2c62
https://ddownload.com/5qzqf0bo53k8

https://rapidgator.net/file/b9943c5e7f098b3d99e1c5635ce9707b
https://rapidgator.net/file/492ba180091bfcbb0e60cf0b83f2af43
Related News
System Comment
Information
 Users of Visitor are not allowed to comment this publication.
Facebook Comment
Member Area
Top News


